The cost of healthcare for average Canadian households
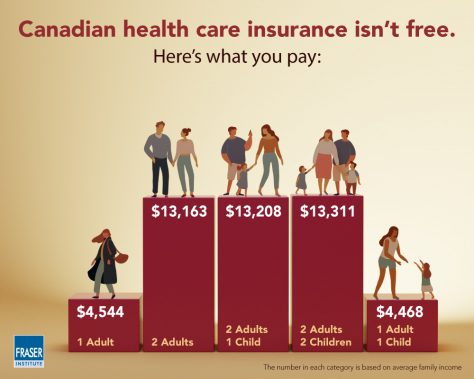
I found two interesting studies from Canada’s Angus Reid Institute describing single payer health care in Canada. I’m very interested in find out what things are like in countries that have true government-run health care. A typical Canadian family pays $13,000+ per year per household for healthcare, or about $585,000 over their working lives. What are they getting for all that money?
The study finds more than 2 million Canadians aged 55 and older face significant barriers when accessing the health care system in their province, such as being unable to find a family doctor or experiencing lengthy wait-times for surgery, diagnostic tests, or specialist visits.
Moreover, most Canadians in this age group have at least some difficulty getting the care they want or need in a timely manner.
The study focuses on the health care experiences of older Canadians, as well as their assessments of the quality of care they receive.
According to the article, 31% of respondents (aged 55 and older) rated access to the government’s healthcare system as “easy”. 48% had “moderate” problems with access, and 21% had “major” problems with access.
Remember: in the Canadian system, you pay your money up front in taxes, and then they decide how much healthcare you will get later – and how soon you will get it. If you worked from ages 20 to age 65, then your household will have paid 45 x $13,000 = $585,000 into the system, in order to get “moderate” problems with accessing healthcare after you’re aged 55.
And the Canadian system DOES NOT cover prescription drugs.
This second part of the study finds one-in-six Canadians (17%) in the 55-plus age group – a figure that represents upwards of 1.8 million people – say that they or someone else in their household have taken prescription drugs in a way other than prescribed because of cost.
One-in-ten (10%) have decided to simply not fill a prescription because it was too expensive, and a similar number (9%) have decided not to renew one for the same reason. One-in-eight (12%) have taken steps to stretch their prescriptions, such as cutting pills or skipping doses.
Some 17 per cent of Canadians 55 and older have done at least one of these things, and that proportion rises among those who have greater difficulty accessing other aspects of the health care system.
In a previous blog post, I reported on how Canadians have to wait in order to see their GP doctor. If that doctor refers them to a specialist, then they have to wait to see the specialist. And if that specialist schedules surgery, then they have to wait for their surgery appointment. The delays can easily go from weeks to months and even years. The MEDIAN delay from GP referral to treatment is 19.5 weeks.
But remember – they paid into the system FIRST. The decisions about when and if they will be treated are made later, by experts in the government. This is what it means for a government monopoly to run health care. There are no free exchanges of money for service in a competitive free market. Costs are controlled by delaying and withholding treatment. And no one knows this better than elderly Canadians themselves. But by the time they realize how badly they’ve been swindled, it’s too late to get their money back out. You can’t pull your tax money out of government if you are disappointed with the service you receive. There are no refunds. There are no returns.
The cost of healthcare for average Canadian households
I found two interesting studies from Canada’s Angus Reid Institute describing single payer health care in Canada. I’m very interested in find out what things are like in countries that have true government-run health care. A typical Canadian family pays $13,000+ per year per household for healthcare, or about $585,000 over their working lives. What are they getting for all that money?
The study finds more than 2 million Canadians aged 55 and older face significant barriers when accessing the health care system in their province, such as being unable to find a family doctor or experiencing lengthy wait-times for surgery, diagnostic tests, or specialist visits.
Moreover, most Canadians in this age group have at least some difficulty getting the care they want or need in a timely manner.
The study focuses on the health care experiences of older Canadians, as well as their assessments of the quality of care they receive.
According to the article, 31% of respondents (aged 55 and older) rated access to the government’s healthcare system as “easy”. 48% had “moderate” problems with access, and 21% had “major” problems with access.
Remember: in the Canadian system, you pay your money up front in taxes, and then they decide how much healthcare you will get later – and how soon you will get it. If you worked from ages 20 to age 65, then your household will have paid 45 x $13,000 = $585,000 into the system, in order to get “moderate” problems with accessing healthcare after you’re aged 55.
And the Canadian system DOES NOT cover prescription drugs.
This second part of the study finds one-in-six Canadians (17%) in the 55-plus age group – a figure that represents upwards of 1.8 million people – say that they or someone else in their household have taken prescription drugs in a way other than prescribed because of cost.
One-in-ten (10%) have decided to simply not fill a prescription because it was too expensive, and a similar number (9%) have decided not to renew one for the same reason. One-in-eight (12%) have taken steps to stretch their prescriptions, such as cutting pills or skipping doses.
Some 17 per cent of Canadians 55 and older have done at least one of these things, and that proportion rises among those who have greater difficulty accessing other aspects of the health care system.
In a previous blog post, I reported on how Canadians have to wait in order to see their GP doctor. If that doctor refers them to a specialist, then they have to wait to see the specialist. And if that specialist schedules surgery, then they have to wait for their surgery appointment. The delays can easily go from weeks to months and even years. The MEDIAN delay from GP referral to treatment is 19.5 weeks.
But remember – they paid into the system FIRST. The decisions about when and if they will be treated are made later, by experts in the government. This is what it means for a government monopoly to run health care. There are no free exchanges of money for service in a competitive free market. Costs are controlled by delaying and withholding treatment. And no one knows this better than elderly Canadians themselves. But by the time they realize how badly they’ve been swindled, it’s too late to get their money back out. You can’t pull your tax money out of government if you are disappointed with the service you receive. There are no refunds. There are no returns.
So, I’ve noticed that many men who are interested in marriage have been running into problems with their plans. One challenge is the problem of the financial costs of marriage. In order to undertake a marriage enterprise, men have to believe that they can pay the bills. And this is especially challenging to men who want a stay-at-home wife to raise their children.
*Please note that I am talking about unmarried (never married, divorced) women throughout this post.
Here’s my argument for why I think that feminism has made it harder for men to afford to get married:
Feminism caused no-fault divorce.
No-fault divorce laws led to more frequent divorces.
Divorced women turn to government for financial support.
Taxes increase in order to pay for more government spending.
Men who were interested in marriage were hit with higher taxes, which made marriage enterprise financially unfeasible for them.
Households of 2010 don’t look quite like they did in 1969, when no-fault divorce actually was a controversial topic and these counter-arguments held some weight. The working dad/stay-at-home mom model of the middle class has been replaced by two-parent earner households and a growing number of working mom/stay-at-home dad arrangements. In working poor and impoverished families, the one-parent provider model was never the norm. No-fault divorce seemed scary when it had never before existed, but the truth is that its introduction was long overdue. Feminist groups at the time supported no-fault divorce, as it provided women an escape hatch from desperately unhappy marriages in a society where they were already disadvantaged on almost every level, regardless of their marital status. Imagine an abusive marriage in 1968, when the court-savvy abuser could actually force the victim to stay in the relationship forever. Imagine that now, and you know why domestic violence attorneys are in full support of introducing no-fault divorce to New York. And the judges aren’t the only problem.
Note that the author of this piece thinks that it is not women’s fault that they choose men who they then want to divorce. It’s not the woman’s fault that she is unhappy with the man she courted with and then chose and then made vows to. She isn’t responsible for choosing a good man with chastity, sobriety, moral convictions, etc. She thinks that women shouldn’t be held responsible for their choices. Also, feminists think that children do fine without fathers.
This paper analyzes a panel of 18 European countries spanning from 1950 to 2003 to examine the extent to which the legal reforms leading to “easier divorce” that took place during the second half of the 20th century have contributed to the increase in divorce rates across Europe. We use a quasi-experimental set-up and exploit the different timing of the reforms in divorce laws across countries. We account for unobserved country-specific factors by introducing country fixed effects, and we include country-specific trends to control for time-varying factors at the country level that may be correlated with divorce rates and divorce laws, such as changing social norms or slow moving demographic trends. We find that the different reforms that “made divorce easier” were followed by significant increases in divorce rates. The effect of no-fault legislation was strong and permanent, while unilateral reforms only had a temporary effect on divorce rates. Overall, we estimate that the legal reforms account for about 20 percent of the increase in divorce rates in Europe between 1960 and 2002.
It seems obvious, but more evidence never hurts. About 70% of divorces are initiated by women, either because they chose to marry the wrong man, or because they become unhappy with the right man.
Giving women the right to vote significantly changed American politics from the very beginning. Despite claims to the contrary, the gender gap is not something that has arisen since the 1970s. Suffrage coincided with immediate increases in state government expenditures and revenue, and these effects continued growing as more women took advantage of the franchise. Similar changes occurred at the federal level as female suffrage led to more liberal voting records for the state’s U.S. House and Senate delegations. In the Senate, suffrage changed voting behavior by an amount equal to almost 20 percent of the difference between Republican and Democratic senators. Suffrage also coincided with changes in the probability that prohibition would be enacted and changes in divorce laws.
[…]More work remains to be done on why women vote so differently, but our initial work provides scant evidence that it is due to self-interest arising from their employment by government. The only evidence that we found indicated that the gender gap in part arises from women’s fear that they are being left to raise children on their own (Lott and Kenny 1997). If this result is true, the continued breakdown of the family and higher divorce rates imply growing political conflicts between the sexes.
Bigger government must be paid for by higher taxes, which makes it harder for one working man’s income to provide for a family. In fact, feminists wanted men to be displaced as sole-providers. They would prefer that women are “equal” to men, and that means making women get out and work like men. It was no concern of theirs that children would be raised by strangers in daycares and government schools.
On Tuesday, the nation made history. It made history in electing the first African American president; it made history in building a bigger margin for the first female Speaker of the House; it made history in delivering the biggest Democratic margin since 1964; it made history in sending a record number of people to the polls and the highest percentage turnout since the 1960 election. Analysts will spend the next few months sifting through the data, trying to figure out what happened and why. Historians will likely spend the next several years and decades studying this election, as well. But one thing is immediately clear. Unmarried women played a pivotal role in making this history and in changing this nation. They delivered a stunning 70 to 29 percent margin to Barack Obama and delivered similarly strong margins in races for Congress and the U.S. Senate. Although unmarried women have voted Democratic consistently since marital status has been was tracked, this election represents the highest margin recorded and a 16-point net gain at the Presidential level from 2004.
In fact, there was a recent (2011) study showing that unmarried women do in fact vote for higher taxes and more government as a substitute for a husband’s provider role.
Abstract:
The last three decades have witnessed the rise of a political gender gap in the United States wherein more women than men favor the Democratic party. We trace this development to the decline in marriage, which we posit has made men richer and women poorer. Data for the United States support this argument. First, there is a strong positive correlation between state divorce prevalence and the political gender gap – higher divorce prevalence reduces support for the Democrats among men but not women. Second, longitudinal data show that following marriage (divorce), women are less (more) likely to support the Democratic party.
What follows from voting Democrat?
If more people vote for Democrats then we will get higher taxes to pay for all the government spending. Higher taxes means that a married man can no longer retain enough of his earnings to support a family. And that means his wife has to work, and that means that his children will learn what the daycare workers and government school teachers decide they should learn.
But what do men want out of marriage? Men don’t want to marry a stressed-out competitor, and be yelled at in their own home. They want a homemaker who is focused on her husband and children. They want their children raised by someone who shares their worldview. Men want to produce moral, influential, independent children. Men want to be respected in their homes as sole provider. Men marry in order to lead on moral and spiritual issues. And men understand that a woman who doesn’t work outside the home usually makes a more feminine, supportive partner in the marriage enterprise.
If society, including the parents of daughters and the pastors of daughters, have decided that women don’t have to care about what men want out of marriage, then they should not be surprised that men don’t want marriage. Men may have no-commitment temporary sexual relationships with a secular left feminist who has been focused on her own feminist projects: travel, student loans, promiscuity, career, etc. But they certainly do not marry those women. When it comes to marriage, men want women who embrace the roles of wife and mother. And unlike shoes and handbags, we get a vote about whether or not the marriage happens.