Probably one of the best health care policy experts writing today is Avik Roy, who writes for Forbes magazine.
Here is his latest column, which I think is useful for helping us all get better at debating health care policy. (H/T Matt from Well Spent Journey)
Excerpt:
It’s one of the most oft-repeated justifications for socialized medicine: Americans spend more money than other developed countries on health care, but don’t live as long. If we would just hop on the European health-care bandwagon, we’d live longer and healthier lives. The only problem is it’s not true.
[…]If you really want to measure health outcomes, the best way to do it is at the point of medical intervention. If you have a heart attack, how long do you live in the U.S. vs. another country? If you’re diagnosed with breast cancer? In 2008, a group of investigators conducted a worldwide study of cancer survival rates, called CONCORD. They looked at 5-year survival rates for breast cancer, colon and rectal cancer, and prostate cancer. I compiled their data for the U.S., Canada, Australia, Japan, and western Europe. Guess who came out number one?
Here is the raw data:
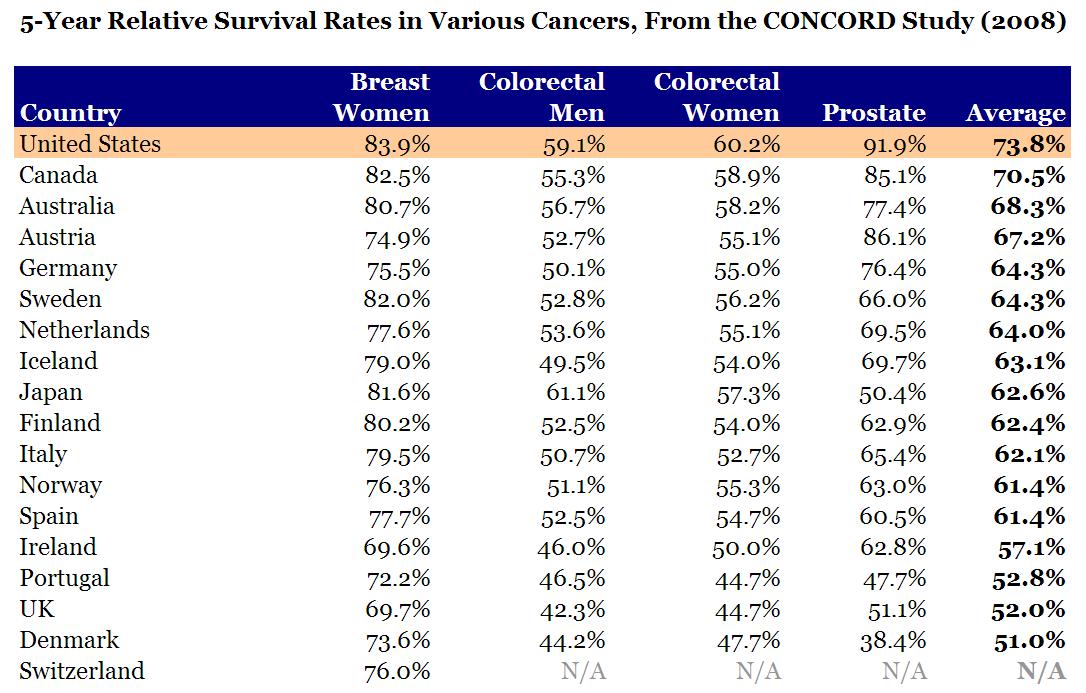
Click here to see the larger graph.
So, what explains this?
The article continues:
Another point worth making is that people die for other reasons than health. For example, people die because of car accidents and violent crime. A few years back, Robert Ohsfeldt of Texas A&M and John Schneider of the University of Iowa asked the obvious question: what happens if you remove deaths from fatal injuries from the life expectancy tables? Among the 29 members of the OECD, the U.S. vaults from 19th place to…you guessed it…first. Japan, on the same adjustment, drops from first to ninth.
It’s great that the Japanese eat more sushi than we do, and that they settle their arguments more peaceably. But these things don’t have anything to do with socialized medicine.
Finally, U.S. life-expectancy statistics are skewed by the fact that the U.S. doesn’t have one health-care system, but three: Medicaid, Medicare, and private insurance. (A fourth, the Obamacare exchanges, is supposed to go into effect in 2014.) As I have noted in the past, health outcomes for those on government-sponsored insurance are worse than for those on private insurance.
To my knowledge, no one has attempted to segregate U.S. life-expectancy figures by insurance status. But based on the data we have, it’s highly likely that those on private insurance have the best life expectancy, with Medicare patients in the middle, and the uninsured and Medicaid at the bottom.
I know that my readers who like to dig deep into economics and policy will love the links at the bottom of the article:
For further reading on the topic of life expectancy, here are some recommendations. Harvard economist Greg Mankiw discusses some of the confounding factors with life expectancy statistics, citing this NBER study by June and Dave O’Neill comparing the U.S. and Canada. (Mankiw calls the misuse of U.S. life expectancy stats “schlocky.”) Chicago economist Gary Becker makes note of the CONCORD study in this blog post. In 2009, Sam Preston and Jessica Ho of the University of Pennsylvania published a lengthy analysis of life expectancy statistics, concluding that “the low longevity ranking of the United States is not likely to be a result of a poorly functioning health care system.”
The funniest thing I have found when talking to people from countries with socialized health care systems, like Canada and the UK, is that they are woefully uninformed about American health care. They literally do not know about free emergency room care, which is free for anyone regardless of insurance – including illegal aliens. They do not know about our expensive Medicaid program, which helps people who cannot afford health insurance. And our very very expensive Medicare program, which provides health care to the elderly – including prescription drugs. I get the feeling that foreign critics of American health care are getting their views from amateur documentaries produced by uneducated Hollywood propagandists, or maybe from TV shows on the Comedy Channel. They certainly are not getting their information from peer-reviewed studies by credentialed scholars from top universities, like the ones cited above.
I have literally spoken to Canadians who think that people in the USA without insurance do not get treatment and just die in the streets from stab wounds. They don’t know about the emergency room rule, or about charity care, or about Medicaid and Medicare. There is a lot of ignorance up there – wilful ignorance, in some cases. And keep in mind that the average Canadian household is paying over $11,000 a year for this substandard health care! They are paying more for less, and that’s not surprising since a large chunk of the taxes that are collected for health care go to overpaid unionized bureaucrats. Naturally, when their left-wing politicians need treatment, the first place they go is to the United States, where they pay out of pocket for the better health care. But that doesn’t stop them from denouncing American health care when they are talking to voters.
Higher infant mortality rates?
One of the other common arguments you hear from uninformed people outside the USA is the higher infant mortality rates argument.
Here’s an article by Stanford University professor Scott Atlas to explain why the argument fails.
Excerpt:
Virtually every national and international agency involved in statistical assessments of health status, health care, and economic development uses the infant-mortality rate — the number of infants per 1,000 live births who die before reaching the age of one — as a fundamental indicator. America’s high infant-mortality rate has been repeatedly put forth as evidence “proving” the substandard performance of the U.S. health-care system.
[…]n a 2008 study, Joy Lawn estimated that a full three-fourths of the world’s neonatal deaths are counted only through highly unreliable five-yearly retrospective household surveys, instead of being reported at the time by hospitals and health-care professionals, as in the United States. Moreover, the most premature babies — those with the highest likelihood of dying — are the least likely to be recorded in infant and neonatal mortality statistics in other countries. Compounding that difficulty, in other countries the underreporting is greatest for deaths that occur very soon after birth.
[…]The United States strictly adheres to the WHO definition of live birth (any infant “irrespective of the duration of the pregnancy, which . . . breathes or shows any other evidence of life . . . whether or not the umbilical cord has been cut or the placenta is attached”) and uses a strictly implemented linked birth and infant-death data set. On the contrary, many other nations, including highly developed countries in Western Europe, use far less strict definitions, all of which underreport the live births of more fragile infants who soon die. As a consequence, they falsely report more favorable neonatal- and infant-mortality rates.
[…]Neonatal deaths are mainly associated with prematurity and low birth weight. Therefore the fact that the percentage of preterm births in the U.S. is far higher than that in all other OECD countries — 65 percent higher than in Britain, and more than double the rate in Ireland, Finland, and Greece — further undermines the validity of neonatal-mortality comparisons.
You can listen to a podcast with Dr. Atlas here, from the Library of Economics web site.
If you want to read more about how American health care compares with health care in socialized systems, read this article by Stanford University professor of medicine Dr. Scott Atlas. And you can get his book “In Excellent Health: Setting the Record Straight on America’s Health Care” from Amazon.