
The non-partisan web site Just Facts has been cited as an authority by IBM, PBS, Vanderbilt University, the Wall Street Journal, etc. In their latest study, they tested conservative and progressive voters to see which group had reality-based views of education, taxes, healthcare, national debt, pollution, government spending, Social Security, global warming, energy, hunger, and poverty.
Here is what they measured:
The findings are from a nationally representative annual survey commissioned by Just Facts, a non-profit research and educational institute. The survey was conducted by Triton Polling & Research, an academic research firm that used sound methodologies to assess U.S. residents who regularly vote.
While most polls measure public opinion, this unique one measures voters’ knowledge of major issues facing the nation—such as education, taxes, healthcare, national debt, pollution, government spending, Social Security, global warming, energy, and hunger.
I just wanted to list out a few of the questions, so that you would be able to see the topics, and know that the answers are measurable quantities. This is important because we want to know which groups of voters understand just the facts about the world we live in.
Education sample question:
On average across the United States, how much do you think public schools spend per year to educate each classroom of students? Less or more than $150,000 per classroom per year?
Correct Answer: More than $150,000. The average cost to educate a classroom of public school students is about $332,000 per year.
Correct answer given by 36% of all voters, 26% of Democrat voters, 45% of Trump voters, 46% of males, 28% of females, 25% of 18 to 34 year olds, 40% of 35 to 64 year olds, and 33% of 65+ year olds.
Taxes sample question:
On average, who would you say pays a greater portion of their income in federal taxes: The middle class or the upper 1% of income earners?
Correct Answer: The upper 1%. The Congressional Budget Office, the U.S. Treasury, and the Tax Policy Center have all documented that households in the top 1% of income pay an average effective federal tax rate of about 33%, while middle-income households pay about 13%. These tax rates account for nearly all income and federal taxes.
Correct answer given by 18% of all voters, 6% of Democrat voters, 30% of Trump voters, 21% of males, 15% of females, 11% of 18 to 34 year olds, 19% of 35 to 64 year olds, and 19% of 65+ year olds.
Spending sample question:
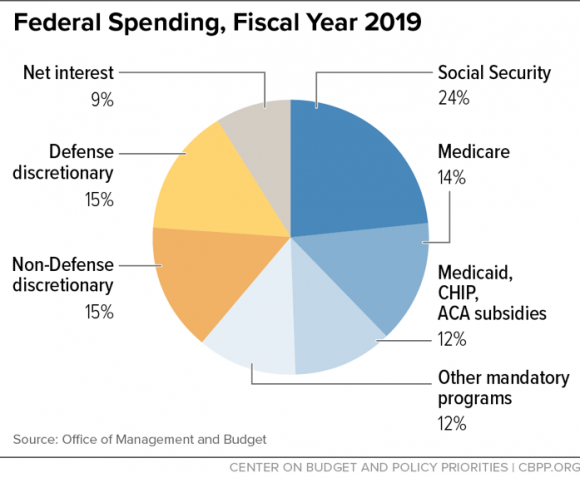
Do you think the federal government spends more money on social programs, such as Medicare, education, and food stamps—or does the federal government spend more money on national defense, such as the Army, Navy, and missile defense?
Correct Answer: Social programs. In 2018, 62% of federal spending was for social programs, and 18% was for national defense. In 1960, the opposite was true, and 53% of federal spending was for national defense, while 21% was for social programs.
Correct answer given by 36% of all voters, 14% of Democrat voters, 59% of Trump voters, 40% of males, 33% of females, 23% of 18 to 34 year olds, 36% of 35 to 64 year olds, and 41% of 65+ year olds.
National debt sample question:
What about federal government debt? The average U.S. household owes about $122,000 in consumer debt, such as mortgages and credit cards. Thinking about all federal government debt broken down to a per household basis, do you think the average federal debt per U.S. household amounts to more or less than the average consumer debt per U.S. household?
Correct Answer: More than $122,000. Federal debt is now $23.1 trillion or about $180,000 for every household in the United States.
Correct answer given by 77% of all voters, 76% of Democrat voters, 81% of Trump voters, 75% of males, 80% of females, 84% of 18 to 34 year olds, 79% of 35 to 64 year olds, and 75% of 65+ year olds.
Global warming sample question:
Thinking about the whole planet, do you think the number and intensity of hurricanes and tropical storms have generally increased since the 1980s?
Correct Answer: No. Comprehensive global data shows that the number and intensity of cyclones and hurricanes has been roughly level since the 1980s. This data was originally published in the journal Geophysical Research Letters in 2011 and updated this year. Likewise, the Intergovernmental Panel on Climate Change has reported: “There is low confidence in any observed long-term (i.e., 40 years or more) increases in tropical cyclone activity (i.e., intensity, frequency, duration), after accounting for past changes in observing capabilities.” Regional data that extends back for more than century shows the same.
Correct answer given by 32% of all voters, 4% of Democrat voters, 59% of Trump voters, 40% of males, 25% of females, 19% of 18 to 34 year olds, 36% of 35 to 64 year olds, and 30% of 65+ year olds.
Pollution sample question:
Thinking about the United States, in your opinion, is the air generally more polluted than it was in the 1980s?
Correct Answer: No. EPA data shows that ambient levels of all criteria air pollutants have declined significantly since the 1980s. Criteria air pollutions are those that are deemed by the administrator of the EPA to be widespread and to “cause or contribute to air pollution which may reasonably be anticipated to endanger public health or welfare….” Likewise, combined emissions of hazardous air pollutants have declined by about 50% since the 1990s.
Correct answer given by 56% of all voters, 44% of Democrat voters, 67% of Trump voters, 67% of males, 46% of females, 47% of 18 to 34 year olds, 63% of 35 to 64 year olds, and 49% of 65+ year olds.
Energy sample question:
Without government subsidies, which of these technologies do you think is the least expensive method for generating electricity? Wind turbines, solar panels, or natural gas power plants?
Correct Answer: Natural gas power plants. Determining the costs of electricity-generating technologies is complex, but data from the U.S. Energy Information Administration shows that natural gas is considerably less expensive than wind, and wind is considerably less expensive than solar.
Correct answer given by 40% of all voters, 23% of Democrat voters, 57% of Trump voters, 53% of males, 29% of females, 25% of 18 to 34 year olds, 43% of 35 to 64 year olds, and 41% of 65+ year olds.
Hunger sample question:
On an average day, what portion of U.S. households with children do you believe will have at least one child who experiences hunger? Less than 1%, 1% to 10%, or more than 10%?
Correct Answer: Less than 1%. Per the latest data from the USDA, 0.14% or less than one out of every 700 U.S. households with children have any child who experiences hunger on an average day. This includes children who are hungry due to poverty, not those who skip meals because they are late for school, don’t feel like eating, or are trying to lose weight.
Correct answer given by 12% of all voters, 2% of Democrat voters, 22% of Trump voters, 15% of males, 9% of females, 3% of 18 to 34 year olds, 12% of 35 to 64 year olds, and 13% of 65+ year olds.
Social Security sample question:
Some policymakers are proposing that individuals be allowed to save and invest some of their Social Security taxes in personal accounts instead of paying these taxes to the Social Security program. In your view, do you think such proposals generally improve or harm the finances of the Social Security program?
Correct Answer: Improve. As shown by analyses conducted by the chief actuary of the Social Security Administration and a bipartisan presidential commission, proposals to give Social Security an element of personal ownership generally strengthen the program’s finances. Although some tax revenues that would have gone to the program instead go to people’s personal retirement accounts, these tax revenues are more than offset by the savings of not paying these individuals full benefits.
Correct answer given by 22% of all voters, 11% of Democrat voters, 33% of Trump voters, 28% of males, 17% of females, 31% of 18 to 34 year olds, 20% of 35 to 64 year olds, and 23% of 65+ year olds.
Health care sample question:
In 2010, Congress passed and President Obama signed the Affordable Care Act, also known as “Obamacare.” This law uses price controls to save money in the Medicare program. Do you think these price controls will worsen Medicare patients’ access to care?
Correct Answer: Yes. As explained by Medicare’s actuaries, the price controls in the Affordable Care Act will cut Medicare prices for many medical services over the next three generations to “less than half of their level under the prior law.” The actuaries have been clear that this will likely cause “withdrawal of providers from the Medicare market” and “severe problems with beneficiary access to care.”
Correct answer given by 50% of all voters, 17% of Democrat voters, 80% of Trump voters, 53% of males, 46% of females, 38% of 18 to 34 year olds, 52% of 35 to 64 year olds, and 49% of 65+ year olds.
Poverty sample question:
Including government benefits and private charity, how much worth of goods and services do the poorest 20% of U.S. households consume on average each year? Less than $20,000, $20,000 to $40,000, or more than $40,000?
Correct Answer: According to the latest government data, the poorest 20% of U.S. households consumed an average of $57,049 of goods and services per household in 2010.
Correct answer given by 13% of all voters, 6% of Democrat voters, 20% of Trump voters, 13% of males, 14% of females, 15% of 18 to 34 year olds, 16% of 35 to 64 year olds, and 9% of 65+ year olds.
You can read the full methodology, references and results.
PLEASE SHARE the article if you liked it. There’s nothing in here to fight about, and no one should be offended.

