New study: Tennessee pre-K program provides no educational benefit over control group

This is the most thorough study that I have ever seen evaluating the effectiveness of pre-K programs. The study was done by researchers at Vanderbilt University. (H/T Brad Wilcox tweet)

The study was reported on by the well-respected but leftist Brookings Institute.

They write:

State investments in center-based school readiness programs for preschoolers (pre-K), whether targeted for poor children or universally implemented, have expanded more rapidly than evaluations of their effects. Given the current interest and continuing expansion of state funded pre-K, it is especially important to be clear about the nature of the available evidence for the effectiveness of such programs. Despite widespread claims about proven benefits from pre-K, there is actually strikingly little credible research about the effectiveness of public pre-K programs scaled for statewide implementation.

Like many states that became interested in scaling up a state funded pre-K program in the early 2000’s, voluntary pre-K (TNVPK) was introduced in Tennessee in 1996 as a way to provide academic enhancement to economically disadvantaged children. It expanded in 2005 to an $85 million-plus statewide investment serving 18,000 Tennessee income-eligible children in 935 classrooms across all 95 counties.

Launched in 2009, the TNVPK Effectiveness Study, a coordinated effort between Vanderbilt’s Peabody Research Institute and the Tennessee Department of Education, is a five-year evaluation study funded by the US Department of Education, Institute for Education Sciences. It includes the first randomized control trial of a scaled up state funded pre-K program and the first well-controlled comparison group study of the effects of program participation as children progress through elementary school..

Policymakers and proponents often cite some of the famous early studies of pre-K programs that have shown long term benefits extending into adulthood for the participating children. But those were studies of especially complex programs that are unlike scaled-up public pre-K in many ways. The Vanderbilt study is the first rigorous controlled longitudinal study to be conducted on a large-scale state-funded pre-K program.

And here is a summary of the results:

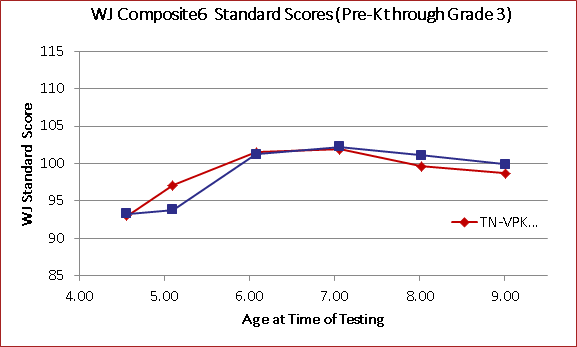
Standard score results from pre-K through 3rd grade on a composite measure that averaged the six achievement subtests are presented from baseline forward in the graph below.

As is evident, pre-K and control children started the pre-K year at virtually identical levels. The TNVPK children were substantially ahead of the control group children at the end of the pre-K year (age 5 in the graph). By the end of kindergarten (age 6 in the graph), the control children had caught up to the TNVPK children, and there were no longer significant differences between them on any achievement measures. The same result was obtained at the end of first grade using two composite achievement measures (the second created with the addition of two more WJIII subtests appropriate for the later grades). In second grade, however, the groups began to diverge with the TNVPK children scoring lower than the control children on most of the measures. The differences were significant on both achievement composite measures and on the math subtests. Differences favoring the control persisted through the end of third grade.

In terms of behavioral effects, in the spring the first grade teachers reversed the fall kindergarten teacher ratings. First grade teachers rated the TNVPK children as less well prepared for school, having poorer work skills in the classrooms, and feeling more negative about school. It is notable that these ratings preceded the downward achievement trend we found for VPK children in second and third grades. The second and third grade teachers rated the behaviors and feelings of children in the two groups as the same; there was a small positive finding for peer relations favoring the TNVPK children by third grade teachers, which did not meet traditional levels of statistical significance.

Results graph:

TNVPK data: pre-K program is in red, baseline is in blue

We are already seeing that cheap daycare in high-tax, big government provinces like Quebec cost a lot, and produce negative results. And of course Hillary Clinton is a longstanding advocate of universal pre-K. As a Senator of New York, she introduced a universal pre-K plan that would cost $10 billion over 5 years. President Barack Obama’s own Preschool for All plan would cost $75 billion over 10 years. This Vanderbilt study should cause us to question whether the policies of the secular left, pushed largely because of emotions and ideology, are worth the tens of billions of dollars they want to take from us. And if you take tens of billions of dollars out of families, then families on the margin will have to give their children to the state to raise. And that includes Christian families, who would no longer be able to afford a stay-at-home mother.

Now, taking children away from parents so that their mothers can work is seen as a worthy goal by those on the secular left. First, communally raising the children is “good” because it removes inequalities between single mothers and traditional working-husband homes. Second, making it easier for women to “go fatherless” is “good” because fathers are not to be trusted to teach their children about morality and religion. That is best left to secular government workers. Third, mothers who choose to marry good providers pay less in taxes if they choose to stay home with their kids and not work. That is “bad” because the government wants more taxes, so they can spend it on vote-buying social programs. Fourth, children who form stable bonds with their parents are less likely to become dependent on the government, meaning their allegiance cannot be bought with government handouts. That is also “bad”. Fifth, it is also “bad” that children who grow up with stay-at-home mothers are more likely to develop empathy and morality, which gives them an independent standard by which to judge the government’s actions.

Related posts

By any measure, Obamacare has been a disastrous failure

Well, the law was supposed to take until now to come into full effect. Now that we are getting the full Obamacare, what are we seeing?

The Wall Street Journal says not enough of the young Democrats who voted for Obamacare are signing up for it:

This month the Health and Human Services Department dramatically discounted its internal estimate of how many people will join the state insurance exchanges in 2016. There are about 9.1 million enrollees today, and the consensus estimate—by the Congressional Budget Office, the Medicare actuary and independent analysts like Rand Corp.—was that participation would surge to some 20 million. But HHS now expects enrollment to grow to between merely 9.4 million and 11.4 million.

Recruitment for 2015 is roughly 70% of the original projection, but ObamaCare will be running at less than half its goal in 2016. HHS believes some 19 million Americans earn too much for Medicaid but qualify for ObamaCare subsidies and haven’t signed up. Some 8.5 million of that 19 million purchase off-exchange private coverage with their own money, while the other 10.5 million are still uninsured. In other words, for every person who’s allowed to join and has, two people haven’t.

Among this population of the uninsured, HHS reports that half are between the ages of 18 and 34 and nearly two-thirds are in excellent or very good health. The exchanges won’t survive actuarially unless they attract this prime demographic: ObamaCare’s individual mandate penalty and social-justice redistribution are supposed to force these low-cost consumers to buy overpriced policies to cross-subsidize everybody else. No wonder HHS Secretary Sylvia Mathews Burwell said meeting even the downgraded target is “probably pretty challenging.”

The program doesn’t work unless young, poor, healthy people are forced to pay for the health care of rich, older, sickly people.

The radically leftist New York Times reports that out of the 22 health insurance co-ops Obamacare created, nine of them have already closed – leaving customers without coverage.

Excerpt:

The grim announcements keep coming, picking up pace in recent weeks.

About a third, or eight, alternative health insurers created under President Obama’shealth care law to spur competition that might have made coverage less expensive for consumers are shutting down. The three largest are among that number. Only 14 of the so-called cooperatives are still standing, some precariously.

The toll of failed co-op insurers, which were intended to challenge dominant companies that wield considerable power to dictate prices, has left about 500,000 customers scrambling to find health insurance for next year. A ninth co-op, which served Iowa and Nebraska, closed in February.

At a time when the industry is experiencing a wave of consolidation, with giants like Anthem and Aetna planning to buy their smaller rivals, the vanishing co-ops will leave some consumers with fewer choices — and potentially higher prices.

The failures include co-ops in New York, Colorado, Kentucky and South Carolina.

The shuttering of these start-ups amounts to what could be a loss of nearly $1 billion in federal loans provided to help them get started. And the cascading series of failures has also led to skepticism about the Obama administration’s commitment to this venture.

UPDATE: A day after this was posted, another IRS co-op has just closed, this time in Utah. Now we are up to 10 out of 22.

Cato Institute health care expert Michael Tanner talks about the increases in health care premiums caused by Obamacare at CNS News:

For example, insurance companies have begun submitting their requests for rate increases for 2016, and those requests suggest that premiums could skyrocket next year. Already we’ve seen requests for increases for individual plans as high as 64.8 percent in Texas, 61 percent in Pennsylvania, 51.6 percent in New Mexico, 36.3 percent in Tennessee, 30.4 percent in Maryland, 25 percent in Oregon, and 19.9 percent in Washington. Those increases would come on top of premium increases last year that were 24.4 percent above what they would have been without Obamacare, according to a study from the National Bureau of Economic Research. At the same time, deductibles for the cheapest Obamacare plans now average about $5,180 for individuals and $10,500 for families.

Recall that on this blog, pretty much all of 2009 and 2010 was spent carefully explaining the moral hazards and other problems created by Obamacare. This was stuff that Republicans knew would happen. But on the other side of the aisle, there was too much naive, youthful exuberance from the secular left. Evidence was ignored, and feelings won the day. Obamacare was passed on the memes and tweets, while the studies reported by people like me went entirely unread.

Investors Business Daily just posted a list of 12 problems with Obamcare for the middle class:

Remember how many times I blogged about this one:

6. Shorter Workweeks

Because ObamaCare’s employer mandate fines don’t apply for workers who average fewer than 30 hours per week, the law gives companies an incentive to put a cap on workhours — particularly for low-wage workers who are less likely to be offered coverage.

The impact isn’t big enough to show up in economywide data, but there’s little doubt that the employer mandate has hurt a lot of people. IBD found 450 employers that capped workhours, and Current Population Survey data show a dive in the share of workers clocking just above 30 hours per week.

And what about the penalty for not buying what the government tells you to:

7. Impact On Wages

In 2016, a company with 50 full-time-equivalent workers could face a penalty of $2,160 per employee (with 30 workers exempted). When the after-tax fine is converted to tax-deductible wages, it equates to $1.71 an hour for a full-time worker.

Who will pay the penalty? For the most part, it won’t be employers — at least not directly. The CBO expects that “the penalty will be borne primarily by workers in the form of reduced wages or other compensation.”

Again, I want to emphasize that it is the evidence-hating secular left that is surprised by these “unexpected” problems with their childish policy. Those of us on the religious right predicted them, because we read the studies that were done before the 2012 election.

The Wall Street Journal reports that the economy’s not doing so well, either:

Changes in quarterly earnings and revenue for S&P 500 companies

In 2006, we handed both the House and Senate to Democrats. The national debt was $8.5 trillion. In 2008, we handed the Presidency to the Democrats. The national debt was $10 trillion. After 10 years of Democrats, we now have a national debt of $18.5 trillion. It has been a long, low-interest, no-growth Keynesian binge. The kind of economics you expect from a socialist community organizer.

Thoughts about atheist tweets, atheist memes and atheist YouTube rants

In this post, I want to show you an atheist tweet, and then contrast the atheist tweet with some scientific evidence.

Look at this meme that was recently tweeted by a serious atheist:

Atheists believe nonsense, and they are proud of it

That’s the tweet, now let’s see the scientific evidence.

Look at this article from the Weather Channel which talks about the most recent NOAA hurricane estimates:

A new hurricane season forecast issued by The Weather Channel on Tuesday says we can expect the number of named storms and hurricanes in the 2015 Atlantic season to stay below historical averages.

A total of nine named storms, five hurricanes and one major hurricane are expected this season, according to the forecast prepared by The Weather Channel Professional Division. This is below the 30-year average of 12 named storms, six hurricanes and three major hurricanes.

[…]The Weather Channel forecast for below-average activity during the 2015 Atlantic hurricane season is consistent with what Colorado State University (CSU) said in its forecast issued on April 9. CSU’s forecast called for seven named storms, including three hurricanes, one of which is predicted to attain major hurricane status.

[…]The 2014 season featured the fewest number of named storms in 17 years (eight storms), but also featured the strongest landfalling hurricane in the mainland U.S. in six years (Hurricane Arthur on the Outer Banks), and featured two back-to-back hurricane hits on the tiny archipelago of Bermuda (Fay, then Gonzalo).

Meanwhile, we should also be concerned about tornadoes, and here is a graph of that:

National Weather Service Tornado trend and averages
National Weather Service Tornado trend and averages (click for larger image)

As of September 25th, 2015 (the black line) is near the record low (the pink line).

By the way, the leftist Los Angeles Times is now reporting that the hurricane caused ZERO deaths. It was much less powerful than the hand-wringing global warmists wanted us to believe.

Previously, I blogged about how the reliable satellite measurements of global temperature show a 19-year pause in “global warming”. And of course we have the Medieval Warming Period (MWP), a period from the 9th to 13th centuries when global temperatures were warmer than they are now. That’s why there are viking villages encased in ice on Greenland. Changes in global temperatures occur naturally, most likely due to solar activity variations.

I understand that it’s fun for atheists to send each other pictures that make them feel smarter than theists, but at the end of the day, we should care about the data, shouldn’t we? I mean, we should be driving at truth using scientific evidence, and not just amuse ourselves with comforting myths that make us feel smug and self-assured.

Who’s irrational now?

Now, let’s take a more generalized look at which group, atheists or theists, are more likely to believe in ridiculous superstitions, using survey data from the center-left Pew Research Center (and not some meme tweeted on Twitter).

The Pew Research survey is here.

Here are the parts that I found interesting:

More:

Notice the numbers for Republicans vs Democrats, conservatives vs. liberals, and church-attending vs non church-attending. The least superstitious people are conservative evangelical Republicans, while the most superstitious people are Democrat liberals who don’t attend church. I think there is something to be learned from that. It’s consistent with the results of a Gallup survey that showed that evangelical Christians are the most rational people on the planet.

Here’s the Wall Street Journal article about the survey done by Gallup, entitled “Look Who’s Irrational Now“. Again, this is data, and not some meme tweeted on Twitter.

Excerpt:

The reality is that the New Atheist campaign, by discouraging religion, won’t create a new group of intelligent, skeptical, enlightened beings. Far from it: It might actually encourage new levels of mass superstition. And that’s not a conclusion to take on faith — it’s what the empirical data tell us.

“What Americans Really Believe,” a comprehensive new study released by Baylor University yesterday, shows that traditional Christian religion greatly decreases belief in everything from the efficacy of palm readers to the usefulness of astrology. It also shows that the irreligious and the members of more liberal Protestant denominations, far from being resistant to superstition, tend to be much more likely to believe in the paranormal and in pseudoscience than evangelical Christians.

The Gallup Organization, under contract to Baylor’s Institute for Studies of Religion, asked American adults a series of questions to gauge credulity.

[…]The answers were added up to create an index of belief in occult and the paranormal. While 31% of people who never worship expressed strong belief in these things, only 8% of people who attend a house of worship more than once a week did.

Even among Christians, there were disparities. While 36% of those belonging to the United Church of Christ, Sen. Barack Obama’s former denomination, expressed strong beliefs in the paranormal, only 14% of those belonging to the Assemblies of God, Sarah Palin’s former denomination, did. In fact, the more traditional and evangelical the respondent, the less likely he was to believe in, for instance, the possibility of communicating with people who are dead.

When I think of the “weird” things that evangelical Christians believe, I think of the origin of the universe, the cosmic fine-tuning, the origin of life and the sudden origin of animal body plans in the Cambrian. All of that science is superstition to an atheist, and yet all of it is rooted in mainstream science. Not just that, but support for our “weird” views has grown stronger as science has progressed.

There are many, many arguments for theism in general, and Christian theism in particular:

I can accept the fact that an atheist may be ignorant of the science that defeats his atheism, but that’s something that has to be remedied with more studying of the evidence, not tweeting memes to each other and giggling like children. There is no science that supports atheism, just as there is no science that supports superstitions.