Tag Archives: GDP

Conservative Party MP Pierre Poilievre explains how Canada escaped the recession

Conservative M.P. Pierre Poilevre (Nepean-Carleton), a member of the majority government in Canada, explains how Canada embraced the free entreprise system that America has rejected, and the results they got.

Here is the speech that went viral on Youtube:

And here is his article in the liberal Huffington Post.

Excerpt:

In a few days the “fiscal cliff” deadline will arrive and potentially bring massive automatic spending cuts and tax increases. Even if Congress and the President agree to avoid the cliff, the next crisis awaits. Treasury Secretary, Timothy Geithner, wrote the Senate this week to report that the “statutory debt limit will be reached on December 31, 2012,” which will require extraordinary measures to prevent a mass default. These measures will give the government 60 days before it runs out of money and Uncle Sam’s head smashes into the so-called “debt ceiling.”

It has long been said that when the U.S. sneezes, Canada catches a cold. So why have these debt-related ailments in the U.S. not afflicted the Canadian government?

The answer is that Canada has been practicing what the U.S. always preached: free markets, low taxes and minimal state interference. And it is working.

For example, Canada avoided the interventionist policies that led the U.S. to the sub-prime crisis.

In an attempt to expand home ownership, administrations from Carter to Bush Jr. forced banks to offer mortgages to people who would otherwise not qualify for them. Washington then ordered government-sponsored enterprises such as Freddie Mac and Fannie Mae to insure these “sub-prime” mortgages.

According to a 2010 Report on the U.S. Financial Crisis by the World Bank’s Development Research Group, Freddie and Fannie bought an estimated 47 per cent of these toxic mortgages. Harvard financial historian Niall Ferguson indicates that the amount of mortgage debt backed by these government-sponsored enterprises grew from $200-million in 1980 to $4-trillion in 2007.(1) The government pumped so much air into the housing bubble that it burst in 2008. The resulting financial crisis led to government bailouts of the banking sector.

Big government caused the economic crisis. So we are told the solution is more big government. Funny how the problem becomes the solution.

Because the Canadian government did not impose sub-prime mortgages on the country’s charter banks, we avoided the crisis and did not bailout a single financial institution. To keep it that way, Canada’s Finance Minister has ended all government-backed insurance of low-down payment and long-amortization mortgages. In other words, if you want to take on risky debt, taxpayers will not insure you.

Governments must lead by example when managing their own debt and spending. Low debt is the result of low spending. Federal government spending as a share of the overall economy is 15 per cent in Canada (2) and 24 per cent in the U.S. (3). The numbers are not merely the result of prodigious U.S. military spending, though that is certainly a factor. Non-military federal government spending is 14 per cent of Canada’s economy (4), and 18 per cent of America’s (5).

Take a look at some of these graphs from earlier in the year about the Canadian 2012 budget. (This is straight from their government’s web site – they have new transparency/anti=corruption measures now, so the citizens know everything that government does). When comparing the deficit and debt of Canada to the United States, always multiply the Canadian number by 10 to get a benchmark to compare. For example, Canadian GDP is 1.7 trillion, and the US GDP is 15 trillion.

Canada’s budget deficit is around 30 billion, but ours is 1.2 trillion:

Canada Federal Budget Deficit / Surplus 2012

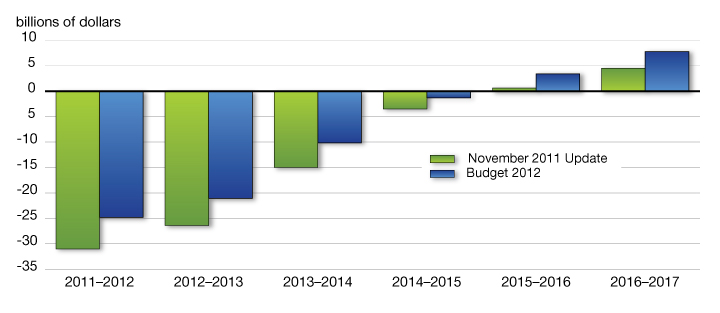
If we were doing as well as Canada, our deficit would be about $300 billion. But we have run up about 6 trillion in debt over 4 years! Not only that, but Canada’s national debt is only $600 billion. If we multiple that by 10, we would expect ours about $6 trillion. And it was that – during the Bush Presidency. But then the Democrats took over the House and Senate in 2007 and everything went wrong and we packed trillions and trillions onto the debt, including about $6 trillion during Obama’s first term.

Canada’s Debt to GDP ratio is 34%:

Canada vs US Debt to GDP

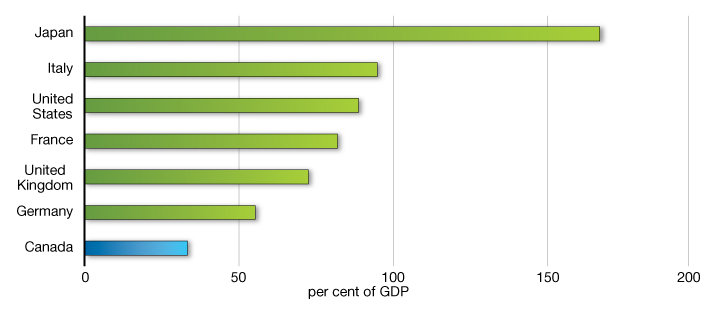
But things are even worse for the United States, now. The current United States Debt to GDP is 105%, according to official U.S. government figures. We are due for yet another credit downgrade, and should see Greece-like levels of Debt to GDP during Obama’s second term. We are spending too much, and we aren’t going to be able to make up trillion dollar deficits even if we confiscate every penny that rich people earn. (And they won’t be daft enough to keep working as hard if we did that – they would move, and probably to Canada)

What is happening to us here in the United States is self-inflicted. We are – and have been – voting to impoverish ourselves and generations of children born and unborn, by punishing those who work hard and play by the rules, and rewarding those who don’t work and don’t play by the rules. It didn’t have to be this way. We could have elected a President who actually knew something about business and economics. Knowledge matters. We can’t just choose a President who gives us the “tingles” and then expect him to perform the actual duties of being President. Competence is more important than confidence. Substance is more important than style.

The long-term impacts of the Romney and Obama economic plans

From the Tax Foundation. (H/T Tom)

Excerpt:

Over the past several weeks, Tax Foundation economists have published a series of studies that analyze the long-term economic and distributional effects of the tax plans outlined by President Barack Obama and Governor Mitt Romney. These comprehensive assessments were done using the Tax Foundation’s Tax Simulation and Macroeconomic Model, which measures how changes in tax policies affect the economic levers that determine economic growth, workers’ incomes and the distribution of the tax burden, says the Tax Foundation.

The candidates’ tax plans would have a starkly different impact on the economy.

  • The Romney plan, which would reduce tax rates on individuals and corporations, would increase gross domestic product (GDP) 7.4 percent over the long run.
  • The Obama plan, which would raise tax rates on individuals, would reduce GDP 2.9 percent over the long run.

These very different futures are the direct consequence of the candidates’ very different approaches to taxing the inputs of production, i.e., capital and labor.

  • Obama would raise taxes on investors, which would reduce the capital stock by 7.5 percent.
  • Romney would reduce taxes on investors, which would increase the capital stock by 18.6 percent.
  • Obama would raise taxes on labor, which would reduce the wage rate by 2.3 percent and hours worked by 0.7 percent.
  • Romney would reduce taxes on labor, which would increase the wage rate by 4.7 percent and hours worked by 2.9 percent.

[…]Tax Foundation’s analysis indicates that for every dollar of tax revenue raised under the Obama plan, the economy loses $10. Under Romney’s plan, for every dollar of tax revenue lost, the economy gains $8.

And more from the Tax Foundation. (H/T Tom)

As a follow-up to the Tax Foundation’s recent assessment of the macroeconomic effects of Governor Mitt Romney’s tax plan, Tax Foundation Senior Fellow Stephen Entin now turns his attention to measuring the macroeconomic effects of President Barack Obama’s tax proposals.

[…]The model results:

  • President Obama’s tax plan would gradually reduce the level of gross domestic product (GDP) by nearly 3 percent, relative to the baseline projection, over five to 10 years.
  • Labor income would be lower by a similar amount, driven down by fewer hours worked and lower wages per hour.
  • The reduction in hours worked, about 0.75 percent, would be the equivalent of about a million jobs lost in today’s economy, with those still employed earning roughly 2.28 percent lower wages.
  • Alternatively, one could view the result as losing four million jobs at unchanged pay levels.
  • The plan would also trim the capital stock by about 7.5 percent (or over $2 trillion in lost investment in plant, equipment and buildings, things that drive productivity, wages and hiring).

The study also measured the economic and distributional effects of President Obama’s corporate tax plan and the tax changes contained in the Affordable Care Act beginning in 2013. The results found that these proposals would lower economic growth while substantially lowering workers’ wages and incomes. Ultimately, President Obama’s tax plans would be very harmful for the nation’s long-term economic outlook.

Do you like prosperity? Would you like to have a job? Would you like to be able to buy things for your friends and family? Would like to be able to give to charities? Then vote for Mitt Romney!

U.S. per person debt now $53,378 – 35% higher than in Greece

Obama 2013 Budget Debt Projection

From the Weekly Standard. (H/T WGB)

Excerpt:

“According to estimates from the International Monetary Fund, America’s total government debt will be $16.8 trillion by the end of the calendar year, compared to $441 billion for Greece,” the Republican side of the Senate Budget Committee explains.

“On a per person basis, that means U.S. debt is $53,400 for every man, woman, and child, compared to $39,400 for every man, woman, and child in Greece. The disparity between per capita debt in the U.S. and Greece has grown 40 percent (roughly $8,400) since 2011. Now, U.S. per person debt is 35 percent higher than that of Greece, and is also higher than per capita debt in Portugal, Italy, or Spain (which together with Greece make up the so-called PIGS countries).”

That’s based on total government debt.

And from CNS News, this for Americans under the age of 18:

If Americans under the age of 18 were required as a group to pay off the entirety of the federal government’s debt in equal shares, each would now need to pay about $218,676.

That is more than the $130,468 average price tag for four years at a private college or the $173,100 median price for an existing one-family home in the United States.

During the time Barack Obama has been president, the U.S. government debt has increased from approximately $143,255 per American under 18 to approximately $218,676 per American under 18–a climb of $75,421 or about 53 percent.

If you know anyone under the age of 18, it might worth explaining this to them.

UPDATE:

H/T The Elusive Wapiti.